Single-cell enrichment score of SBP-relevant gene set
Single-cell scoring
We next aim to test whether SBP‑relevant gene sets show enriched expression in specific cell
subpopulations. zoom adapted the scDRS method proposed Zhang, M. J. et. al., selecting control gene sets based on permuted SBPs to mitigate
spatial autocorrelation–driven false positives, and incorporating gene DS and specificity scores
to reduce technical noise and inter‑individual variability while emphasizing genes with specific,
stable expression patterns. Here we use the negative direction of the sensorimotor–to–visual gradient
(SVG-) as an example:
>>> zoom_obj.get_SBP_score(
        direction=False,
        gene_size=35,
        fdr_method="group_bh",
        alpha=0.1,
        group="Subcluster",
        min_score=3
    )
The results produced by the above code are added directly to zoom_obj.obs. The norm_score column
contains normalized enrichment scores, and the sig_score column contains the normalized enrichment
scores for cells meeting the significance criteria (adjusted p < alpha and norm_score > min_score).
Both can be visualized using scanpy.
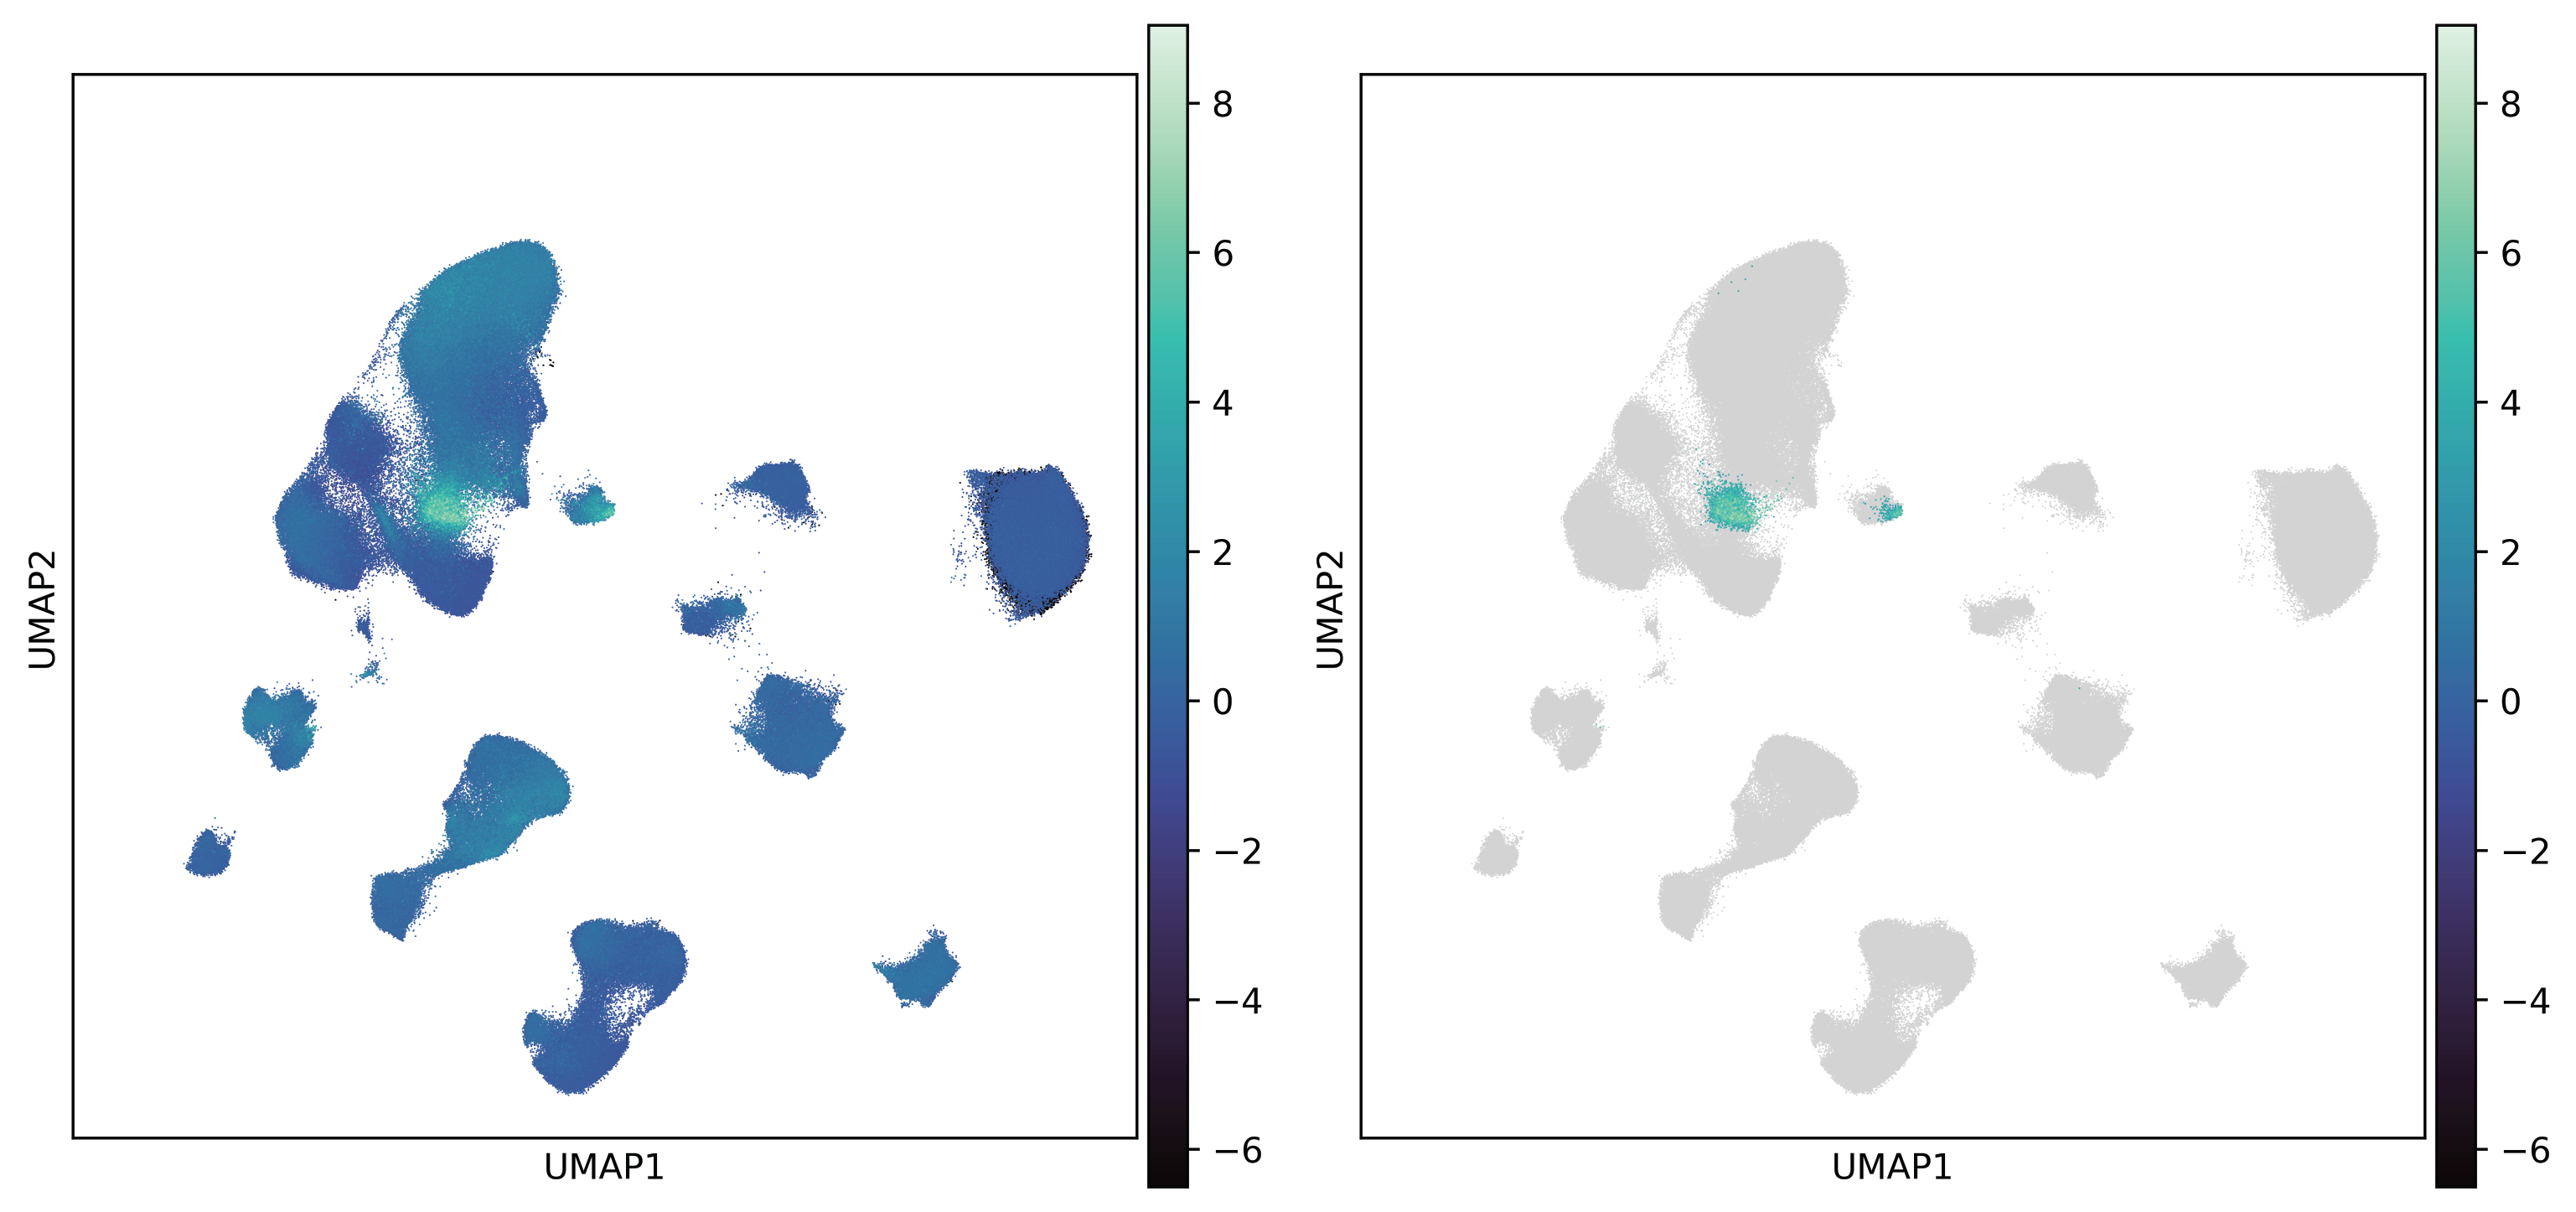
Fig. 7 Single-cell enrichment score of SVG- (left) and significant cell subpopulations are identified (right)
Note
Here, we applied a relatively lenient p-value threshold (alpha=0.1) and milder Group Benjamini-Hochberg
(GBH) FDR correction procedure for multiple comparison correction. As an exploratory analytic framework, this
allows investigators to capture a broader range of potential signals. Nevertheless, we recommend that the
output of ZOOM be interpreted in conjunction with results from multiple sources. Of course, you can also use
Benjamini-Hochberg FDR correction by specifying fdr_method="fdr_bh" and set a more stringent alpha.
Arguments to zoom.prepare.abagen_ctx()
- direction bool
If True, use gene set relevant to the positive direction of given SBP else negative direction.
- gene_size int
Number of genes used for scoring, which has been determined by previous page.
- ctrl_match_key str, default "gss_max"
Gene-level statistics used to guide the selection of control gene sets, must be present in
ZOOM_SC.adata.uns['GENE_STATS'].
- weight_opt str, default "DS"
Gene-level statistics used for re-weighting SBP-relevant gene set, must be present in
ZOOM_SC.adata.uns['GENE_STATS'].
- n_genebin int, default 20
Number of bins for dividing genes by
ctrl_match_key.
- fdr_method str default "fdr_bh"
Method for multiple testing correction, must be one of {“bonferroni”, “sidak”, “holm-sidak”, “holm”, “simes-hochberg”, “hommel”, “fdr_bh”, “fdr_by”, “fdr_tsbh”, “fdr_tsbky”, “group_bh”}.
- alpha float default 0.1
Statistical significance threshold for determining significantly enrichment cells.
- min_score float default 3.0
Minimum enrichment score threshold for determining significantly enrichment cells.
- group str, default None
Column name indicating the cell groups, based on which p-values are adjusted if you use
group_bh, must be present inZOOM_SC.adata.obs. You can skip this if other multiple testing correction methods are used.
Downstream analyses
In the above procedure, zoom identified the cell subpopulations most associated with the target SBP.
We can further perform differential analyses to determine what distinguishes these subpopulations from
other cells within the same major cell class. zoom provides two analyses, differential expressed gene
(DEG) analysis and brain region enrichment analysis, which can be run in a single step with the following
code:
>>> zoom_obj.downstream_ans(
        group="Cluster",
        rank_method="logreg",
        region_col="Area.v2",
        batch_col="Dataset",
        dataset=["Siletti2023"],
        indvd_col="Indvd"
)
The results of downstream analyses are stored in zoom_obj.adata.uns["DEG"] and zoom_obj.adata.uns["Region
Enrichment"] as Python dictionary, respectively. Using L5/6 IT Car3 neuron as an example, the DEG analysis ranks
genes that distinguish the cell subpopulation significantly enriched for the SBP‑relevant gene set from other
cells within the same major cell class, as specified by argument group. This gene ranking can be used for
pathway enrichment analyses (e.g., GSEA) to elucidate the biological significance of the cell subpopulation:
>>> gene_rnk_cell = zoom_obj.adata.uns["DEG"]["L5/6 IT Car3"]
>>> gene_rnk_cell
            Deviation
gene
TMEM196      0.929288
ITGA11       0.929010
...               ...
DLGAP1-AS4  -0.122299
CRTAC1      -0.136448
[7773 rows x  1 columns]
>>> import gseapy as gp
>>> gsea_res_cell = gp.prerank(
        rnk=gene_rnk_cell,
        gene_sets=BP,
        min_size=50,
        max_size=500,
        seed=123
    )
>>> gsea_res_cell.res2d
                                                                 ES       NES  FDR q-val  FWER p-val                              Lead_genes
Term
Cell-Matrix Adhesion (GO:0007160)                          2.264361  0.002439   0.050614       0.039  ITGA11;RCC2;VCL;ITGA7;FERMT2;BCR;ITGB1
Negative Regulation of Wnt Signaling Pathway (GO:0030178)  0.642851  2.249325   0.034947       0.051                    TMEM196;NXN;TMEM170B
...                                                             ...       ...        ...         ...                                     ...
On the other hand, brain region enrichment analysis in zoom assesses whether a significantly enriched
cell subpopulation preferentially localizes to a particular brain region by computing the fold change in
regional distribution between that subpopulation and all cells of the same cell class, which is also specified
by argumant group. Because among available human cortical single‑cell transcriptomic datasets only
Siletti, K. et. al. provided comprehensive, fine‑
grained cortical anatomical annotations, we specify dataset=["Siletti2023"] for brain region enrichment
analysis:
>>> zoom_obj.adata.uns["Region Enrichment"]["L5/6 IT Car3"]
         Indvd1    Indvd2    Indvd3    Mean      Std        p-value     p-fdr
region
A29-A30  3.288462  1.218627  5.054688  3.187259  1.567699  0.064665  0.323325
V2       3.175066  2.589583  3.791016  3.185222  0.490535  0.003100  0.077509
V1C      2.254945  5.650000  1.347917  3.084287  1.851637  0.084158  0.338894
...           ...       ...       ...       ...       ...       ...      ...
TF       0.000000  0.000000  0.652218  0.217406  0.307458  0.915118  0.994693
A38      0.106079  0.000000  0.331455  0.145845  0.138206  0.854161  0.994693
FI       0.000000  0.000000  0.000000  0.000000  0.000000  1.000000  1.000000
[25 rows x  7 columns]
Note
Please note that we specifoed different group for GBH FDR correction and for downstream analyses.
During single‑cell scoring we assume SBP‑relevant gene sets enrich in distinct cell subpopulations (e.g.,
two SBPs may both enrich in L2/3 IT neurons but in different subpopulations), so P‑value correction is
performed with Subcluster as the reference. For downstream analyses, where we aim to compare the
significantly enriched subpopulations to other transcriptionally similar cells that are not enriched for
the target SBP, thus we use the Cluster annotation as the reference.
Arguments to zoom.prepare.abagen_ctx()
- flag_DEG bool, default True
If True, perform the differential expression analysis for all significantly enriched subpopulations.
- flag_region bool, default False
If True, perform the brain region enrichment analysis for all significantly enriched subpopulations.
- group str, optional
Column name of cell type annotation variable for downstream analyses, must be present in
ZOOM_SC.adata.obs.
- rank_method str, default "logreg"
Ranking method for DEG analysis used by
scanpy.tl.rank_genes_groups, must be one of {“wilcoxon”, “logreg”, “t-test”, “t-test_overestim_var”}.
- max_iter int, default 10,000
Maximum iterations for DEG analysis if specifying
rank_method="logreg".
- region_col str, optional
Column name specifying brain region identity, must be present in
ZOOM_SC.adata.obs. If you did not include any anatomically comprehensive scRNA-seq dataset, we recommend you to skip brain region enrichment by default.
- batch_col str, default None
Column name specifying batch identity, from which column datasets used for brain region enrichment analysis are picked, must be present in
ZOOM_SC.adata.obs.
- dataset list, default None
List of selected datasets that will be used in brain region enrichment analysis, must be present in
ZOOM_SC.adata.obs[batch_col]
- indvd_col str, default None
Column name specifying biological replicates. If specified, brain region enrichment analysis will be iterated for all valid reliacates. Must be present in
ZOOM_SC.adata.obs.